VizTracer Python: Your Partner in Bug Detection
Debugging can truly get on your nerves at times.
But that’s part of our job—sometimes more than actual coding itself.
Imagine writing a prime number checker, only to find out it’s identifying non-primes as primes and vice versa. Ouch.
This is just a small example, but imagine a real issue in a major project.
What if you could visualize your code’s execution and understand where things go wrong?
Would that make debugging easier?
Probably.
While surfing, I came across a powerful Python library called VizTracer.
It helps you visualize code execution step by step, making it easier to spot performance bottlenecks, understand function calls, and analyze execution flow.
Let’s test it!
This is just an exploration I am not recommending anything.
VizTracer Python: Your Partner in Bug Detection
Contents
Setting Up VizTracer
Getting started is easy. Just install VizTracer with:
pip install viztracerThat’s it! Now, let’s use it to trace an actual Python program.
Errors And Bugs
While VizTracer doesn’t directly detect logical errors, it provides a detailed breakdown of function calls and execution times, helping you spot unexpected behavior.
For example, consider this simple program that prints prime numbers within a given range:
s = int(input("Enter start of range: "))
e = int(input("Enter end of range: "))

for i in range(s, e + 1):
    if i < 2:
        continue

    flag = True
    for j in range(2, int(i ** 0.5) + 1):
        if i % j == 0:
            flag = True
            break

    if flag:
        print(i, "is Prime")
At first glance, this looks fine, but it incorrectly prints non-prime and primes.
A pure logical error!
This is not something VizTracer is built to catch automatically.
However, it can help us understand execution flow and check whether the issue is caused by an unexpected function call or loop behavior.
Spotting Logical Errors with VizTracer Python
To trace execution with VizTracer Python, modify the script as follows:
from viztracer import VizTracer

s = int(input("Enter start of range: "))
e = int(input("Enter end of range: "))

for i in range(s, e + 1):
    if i < 2:
        continue
    tracer = VizTracer()
    tracer.start()
    flag = True
    for j in range(2, int(i ** 0.5) + 1):
        if i % j == 0:
            flag = True
            break

    if flag:
        print(i, "is Prime")
    tracer.stop()
    tracer.save("result.html")
Now, open result.html in a browser.
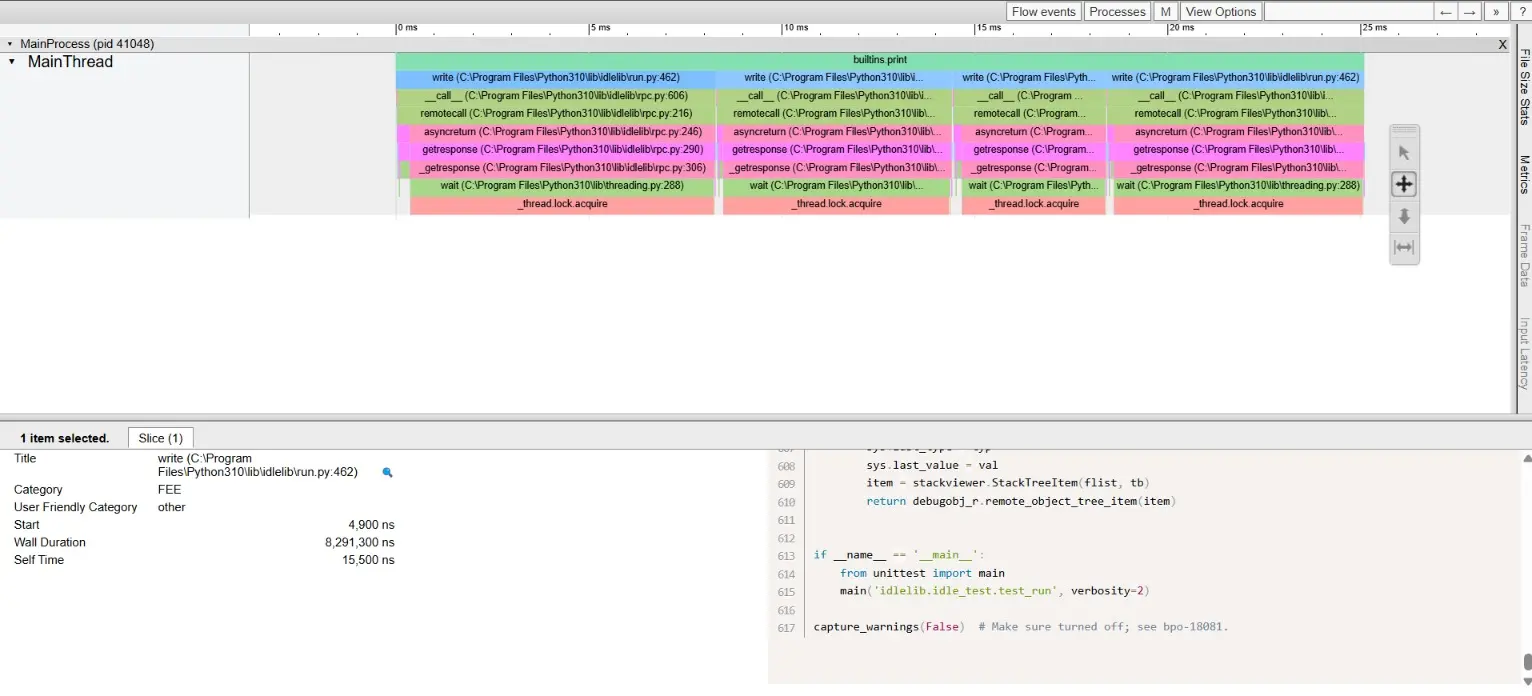
VizTracer generates an interactive timeline, allowing you to inspect function calls, execution times, and see if unexpected loops, redundant computations, or unnecessary function calls are causing issues.
Here’s how it looks:
Why VizTracer is Useful in Large Projects
For a small prime number script, VizTracer might seem like overkill.
But in large systems with multiple functions, asynchronous calls, and threads, it can help:
✅ Analyze function execution times – Spot slow functions that need optimization.
✅ Debug concurrency issues – Identify deadlocks or excessive thread waiting times.
✅ Visualize code execution – Understand which functions are being called and when.
Best Practices for Effective Debugging with VizTracer
- Trace Key Sections – Don’t trace your entire codebase; focus on problematic areas.
- Filter Unnecessary Data – Large scripts generate a lot of data, so use filters to highlight only relevant parts.
- Regularly Review Execution Flow – Using VizTracer often can help you spot performance bottlenecks early.
Conclusion
While VizTracer is not a magic tool for detecting logical errors, it helps in debugging execution flow, optimizing performance, and analyzing code behavior.
Keep experimenting with new tools and expanding your debugging toolkit—there’s more to debugging than just Googling error messages!
With that said, Python-Hub signing off!